
Moneyball for Markets: How to Use Trading Statistics
Apr 19, 2022
By Jay Caauwe
When Billy Beane became the Oakland A’s assistant GM in 1994, baseball as we knew it changed forever. Beane’s studious attention to and execution of Sabermetrics was on full display in both the Michael Lewis book (2003) and Bennett Miller movie (2011) of the same name - Moneyball; it showed his A’s achieving the second best record in baseball in 2002, posting a 20-game winning streak, and finishing with a 103-59 record in great part due to Beane’s infatuation with data and statistics.
Binomial Distribution
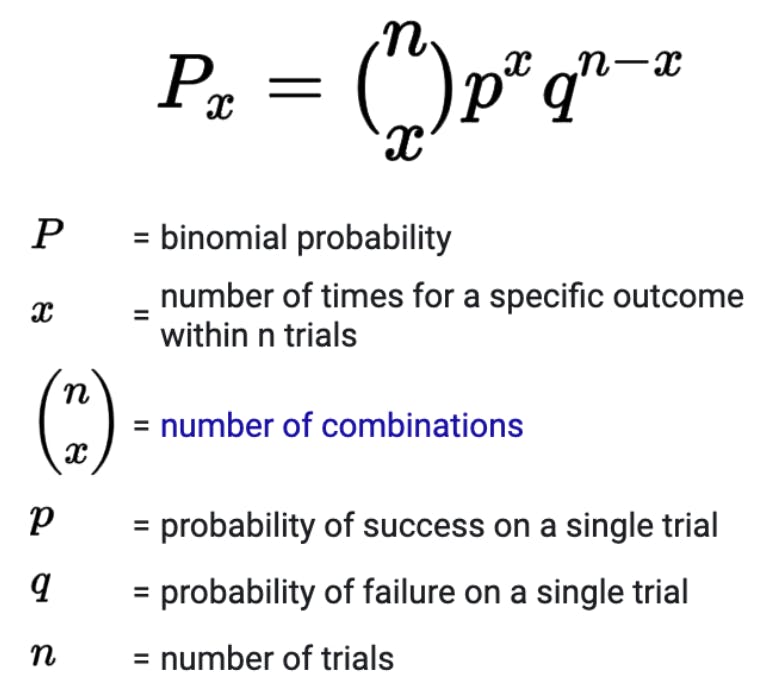
Source: Wikipedia
The underlying premise of Sabermetrics incorporates a method for baseball fans to learn about the sport through objective evidence. Higher math and quantitative analysis were introduced. Applications used include applied statistics (e.g. correlation) and machine learning models, which often incorporate binomial distributions given the game’s binary outcome (win or loss). Sound familiar? Whether a student of sport or of the market, outcomes can be measured with data. Historical and real-time data are just two of the inputs affecting metrics used to trade the market in the same way on-base percentage and earned run average helped Beane assess talent. (Other metrics could include volatility, time to expiration, moving averages, etc.)
Introduction to Trading Statistics: From the Pitch to the Pit
Just as a baseball manager knows what lineup to use against a left-handed pitcher in the deciding playoff game, so can the trader know who they are ‘facing’ on game day thanks to statistics.
SM75® \ Small Stocks 75 Futures
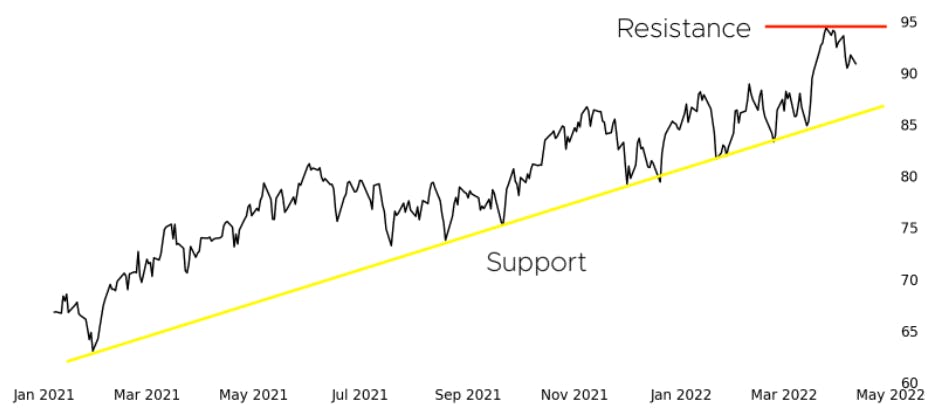
Source: dxFeed
Bases loaded with two outs in the ninth and the score tied can feel a lot like waiting on a Federal Open Market Committee (FOMC) interest rate decision - uncertainty as to the direction or magnitude of the outcome but preparation for more extreme results. Equipped with a playbook of support and resistance levels, pivot points, and standard deviations, traders can effectively be (athletically) nimble to lock in profits, cut losses, or reverse position. Want to stretch that single into a double? The market you’re trading will need to be capable of large moves (i.e. wide standard deviations). Want to take extra profits out of that oil trade with 1 day left to expiry? Check the open interest, term structure, and bid-ask spread against the deferred month, and use your own Sabermetrics to justify not spreading or closing your position.
Standard Deviations and the Stock Market
A simple place to start in applying stats to markets can be with the standard deviation - a measure of a data set’s variance with 68% confidence. The Small Exchange updates standard deviations on close-to-close data for their futures products, and they send the stats to their Community Members at the start of every week. This metric essentially gives you an average daily range, so you know that expecting 3.00 in daily profits on a market with a +/-1.21 standard deviation might be unrealistic. It can also help gauge where to enter:
- For contrarians, you might go against moves outside the standard deviation.
- For trend followers, you might go with moves outside the standard deviation.
Standard Deviation of Small Stocks 75 (SM75) Futures
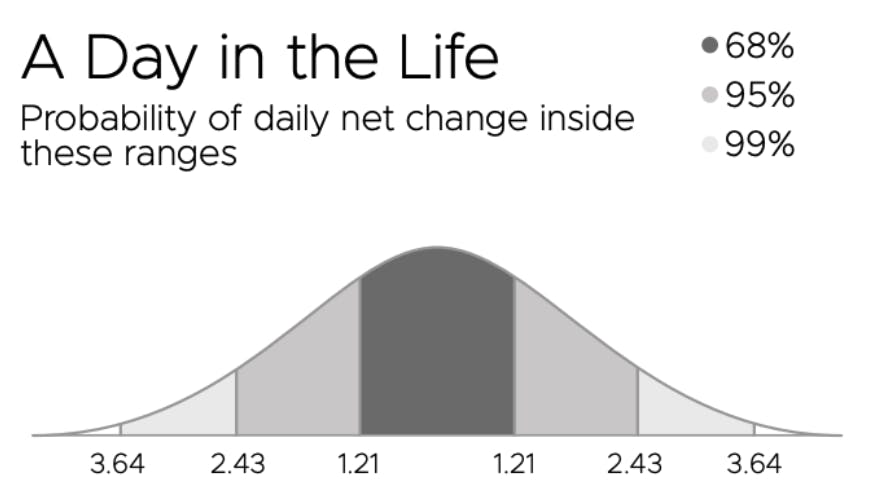
Source: dxFeed
Market data can be as big as you want to make it. Data sets are tools to help make determinations, and they are not one size fits all. Take the time to learn what metrics are most directly tied to your style of trading as well as the asset class that you do trade. And venues like the Small Exchange, with its statistics and content curated for everyday people, can help get you the necessary tools to ensure your next trade doesn’t strike out.
To learn more about using statistics to help make more informed trading decisions readers are encouraged to review the following articles and episodes of Small Stakes:
Sign up for more articles like this with our free weekly market commentary.